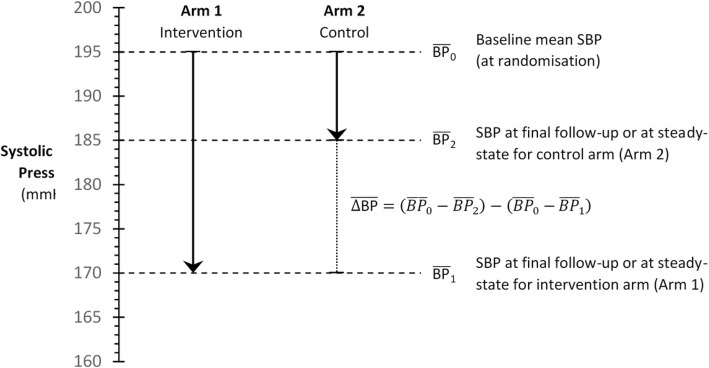
Fig. 2.
Schema illustrating calculation of mean between-group difference in blood pressure. Hypothetical data are presented. In this example, the mean between-group difference in blood pressure would be (195–185) − (195–170) = 10–25 = − 15 mmHg. That is, the intervention drug reduced blood pressure, on average, by 15 mmHg more than the control drug (placebo or active comparator)

