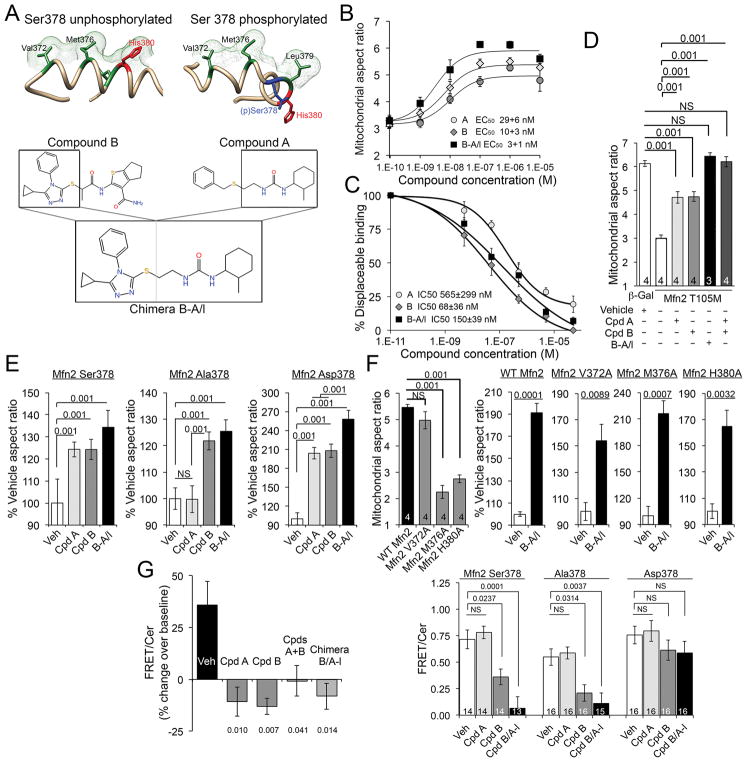
Fig. 2. Small molecule mimetics of Mfn2 HR1 amino acid side chains that interact with HR2 are mitofusin agonists.
(A) (top) Three dimensional representations of hypothetical minipeptide conformations driven by Ser378 phosphorylation, and (bottom) their respective small molecule mimetics. (B) Dose-dependent mitofusin agonism by small molecule agonists. Data represent mean±SEM of 6 independent experiments. (C) Displacement of minipeptide 374–384 from its HR2 binding site by mitofusin agonists. Data represent mean±SEM of 3 independent experiments. (D) Restoration of Mfn2 T105M-impaired mitochondrial fusion in Mfn2−/− MEFs by mitofusin agonists. Data represent mean ± SEM of 3 or 4 independent experiments as indicated. p values were measured by ANOVA. (E) Selectivity of a class A, but not a class B, mitofusin agonist for Ser378-phosphorylated Mfn2.. Data represent mean ± SEM of 4 independent experiments. p values were measured by ANOVA (F) Impaired basal function, but normal proportional agonist responsiveness, of Mfn2 mutations altering HR1-HR2 interacting amino acids. Absolute fusogenicity of these Mfn2 mutants is in fig. S6. Data represent mean±SEM of 4 independent experiments. p values are by ANOVA (left) or Student’s t test. (G) Change in FRET evoked by mitofusin agonists in isolated mitochondria (left) and intact cells (right); decreased FRET reflects conformational opening. Data represent mean±SEM of 3 independent (left) and 14–16 replicate (right) experiments. p values vs vehicle were measured by ANOVA.

