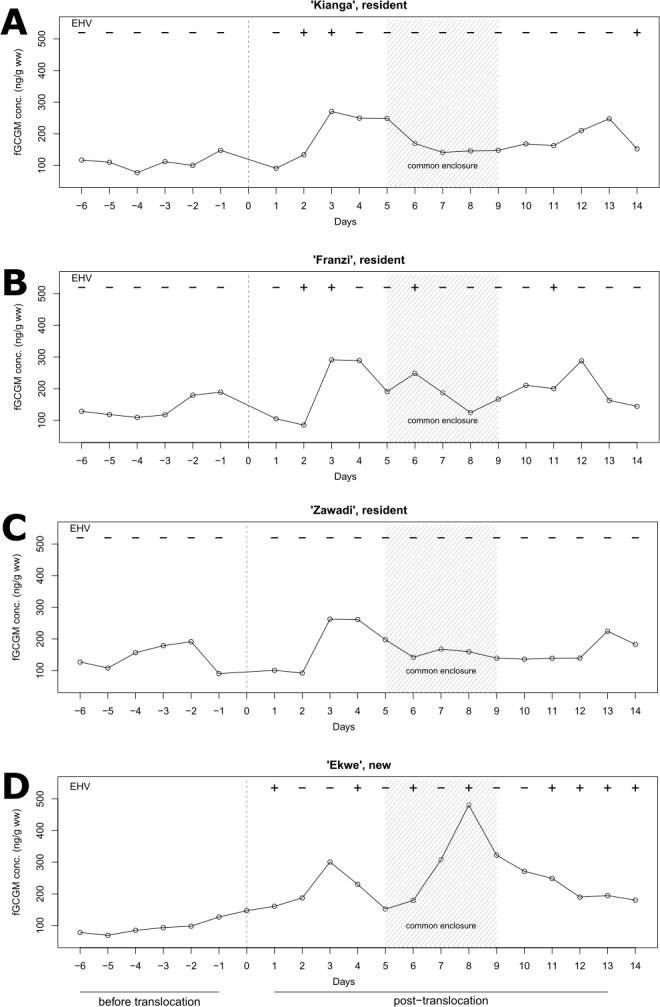
Figure 3. Individual fecal glucocorticoid metabolite (fGCM) and EHV shedding profiles of Grévy’s zebra mares.

fGCM concentrations time-corrected by one day, from day -6 to day 13, and respective EHV shedding status (+ EHV-positive; − EHV-negative) of each individual (A–D) with day 0 indicating the arrival of the translocated mare (D) at Tierpark Berlin. The shaded area (day 5 to day 9) indicates the time period when the four mares shared one common enclosure.
