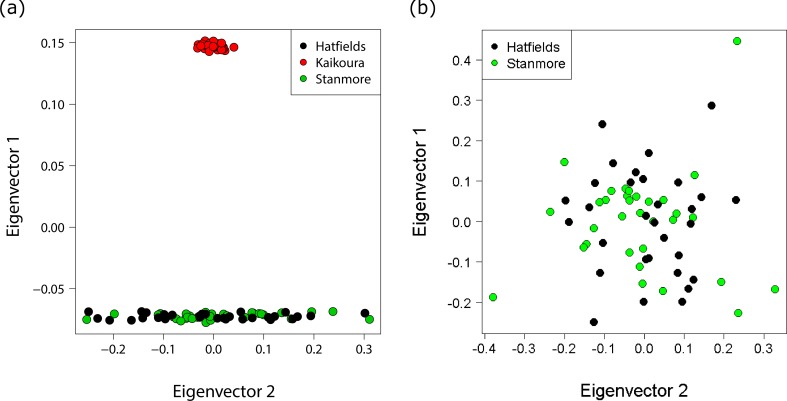
Figure 4. Principal coordinates analysis (PCA) showing individuals coloured by population.
(A) PCA with all populations showing distinct clustering of the Kaikoura population with the first and second principal coordinates explaining 27.8% and 1.2% of the variance respectively. (B) PCA for the North Island populations only with the first and second principal coordinates explaining 2.1% and 2.1% of the variance respectively.

