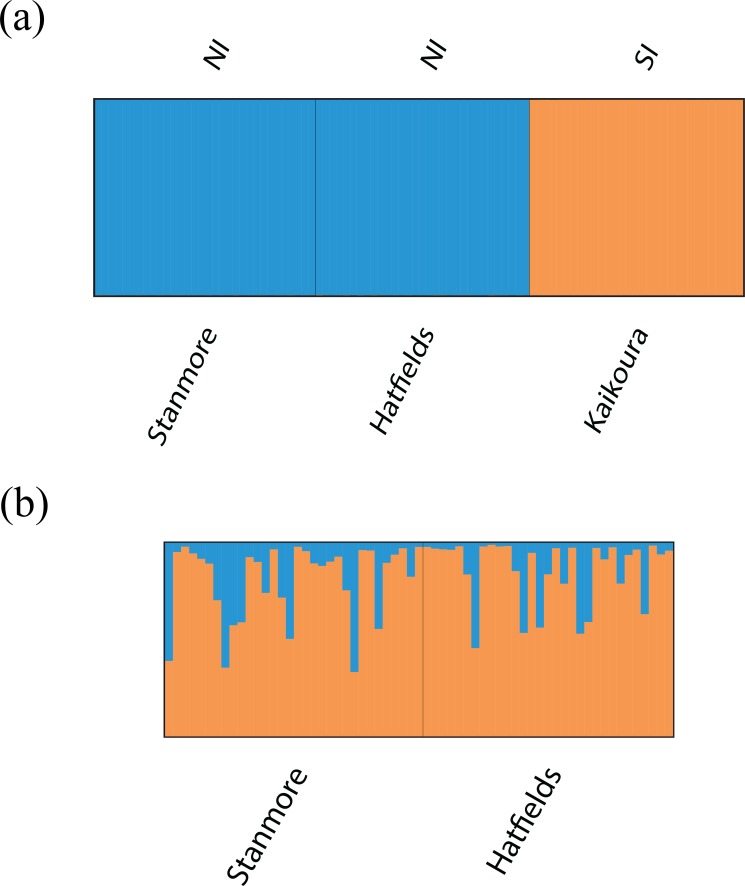
Figure 5. Barplots of STRUCTURE results based on Bayesian clustering algorithms.
Barplots have been summarised over 10 replicates and show proportional membership of (A) 94 individuals of I. armatus to K = 2 genetic clusters and (B) 32 individuals from Stanmore Bay and 31 individuals from Hatfield’s Beach to K = 2 genetic clusters. Colours indicate proportional membership to a genetic cluster. Individuals are ordered by population of origin with vertical bars representing a single individual. NI, North Island, SI, South Island.

