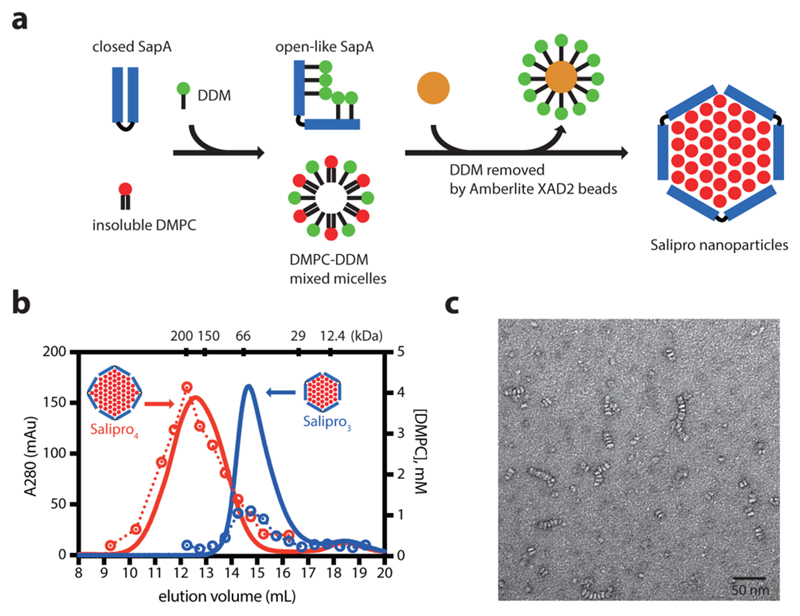
Figure 2.
Generation of SapA-DMPC nanoparticles at pH 6. (a) Schematic representation of the SapA-DMPC nanoparticle assembly. (b) SEC of SapA-DMPC with initial mixing SapA:DMPC ratios of 1:15 (blue) and 1:45 (red) at pH 6. DMPC was quantified by molybdate assay24 (open circle). The proposed SapA arrangement is indicated. (c) Negative-stain EM images of Salipro3. Scale bar, 50 nm.

