Figure.

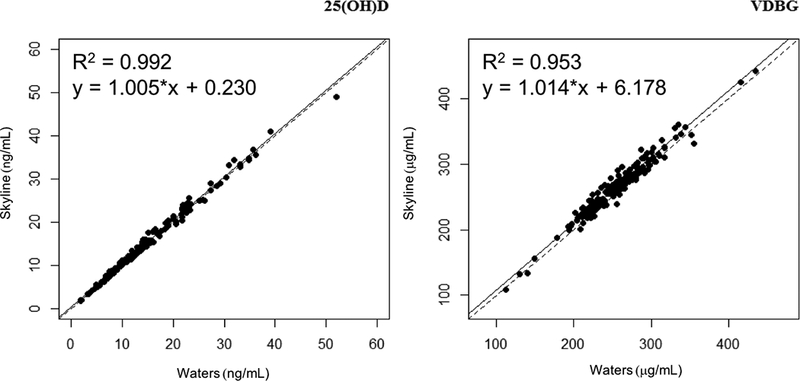
25(OH)D concentrations from 154 serum samples and VDBG concentrations from 164 serum samples. The Deming regression equation is shown (solid line), along with the line of unity (dashed line), and the Pearson correlation coefficient (R2).

25(OH)D concentrations from 154 serum samples and VDBG concentrations from 164 serum samples. The Deming regression equation is shown (solid line), along with the line of unity (dashed line), and the Pearson correlation coefficient (R2).