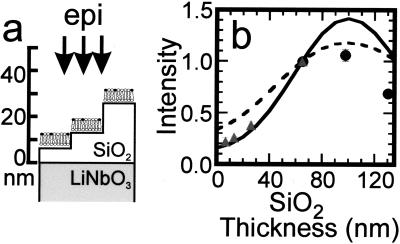
Figure 6.
(a) Schematic diagram of SiO2 stair steps sputtered onto lithium niobate and used to probe the effect of the high refractive index substrate on the fluorescence from 1 mol % Texas red DHPE in assembled supported bilayers. Each region of SiO2 was ≈50 mm2, so the horizontal and vertical scales are very different in this schematic. (b) Intensity of Texas red fluorescence as a function of the SiO2 thickness normalized to the fluorescence measured from the 65-nm SiO2 layer. The fluorescence was excited and collected with an epifluorescence microscope, and background was subtracted as described in Materials and Methods. The gray triangles are data acquired from a single lithium niobate substrate containing 7, 13, 26, and 65-nm layers of SiO2; the black circles are from a substrate containing 65, 98, and 130-nm layers of SiO2. Q(l) is shown by the dashed line, whereas Q(l)⋅S∥(l) is shown by the solid line, where both are normalized to 1 at l = 65 nm. The parameters used to calculate Q(l) and S∥(l) (see text) were: N.A. = 0.45, distance of the fluorophore to the SiO2/aqueous interface = 7 nm, n3 =  = 2.29, n2 =
  = 1.46, n1 =
  = 1.33, λexcite = 585 nm, λemit = 605 nm, and Θ = π/2 (transition dipole moment of Texas red is approximately parallel to the surface; ref. 33).

