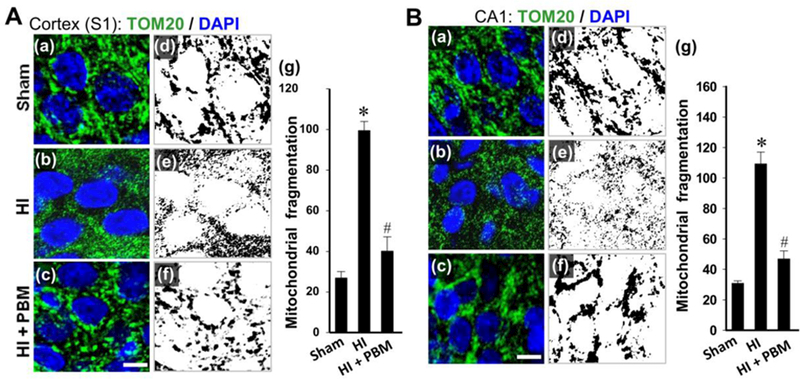
Fig. 3. Effect of PBM treatment on HI-induced changes in mitochondrial fragmentation of cortex and hippocampal pyramidal neurons.

A, B (a-c): Representative immunofluorescence images of Tom20 staining (green) counterstained with nuclear marker DAPI (blue) of cortex (S1) and hippocampal CA1 neurons from P18 animals. Scale bar: 5 µm. A, B (d-g): The immunofluorescence of Tom20 was separated, threshold d, filtered and binarized using Image J program. The counts of total mitochondrial fragmentation were calculated by normalization of the number of total mitochondrial segments to total mitochondrial areas. Data are presented as means ± SE (N = 4–6 in each group). *P < 0.05 versus sham HI control, #P < 0.05 versus HI or HI + sham PBM group.
