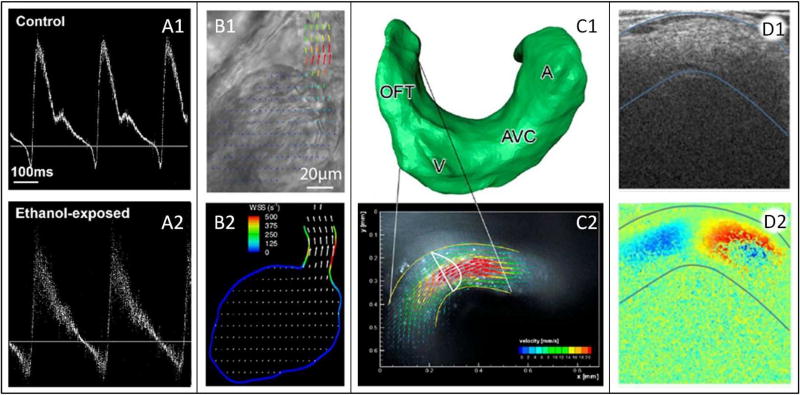
Figure 4. Characterizing Hemodynamics.
(A) Ultrasound trace for 1) untreated and 2) ethanol-injected HH19 avian embryos. Reproduced from (Peterson et al., 2017). (B1) video microscopy frame of a 3 dpf zebrafish heart, overlaid with 2D velocity vector field calculated using PIV; (B2) 2D WSS distribution calculated using the velocities from (B1). Reproduced from (Jamison et al., 2013). (C1) surface reconstructed from a confocal microscopy z-stack of an HH14 avian embryo; (C2) confocal microscopy image, overlaid with 3D velocity vector field calculated using PIV and validated with CFD performed using the mesh from (C1). Reproduced from (Hierck et al., 2008). (D1) OCT structural image of an HH18 avian outflow tract; (D2) concurrently collected Doppler OCT image (both overlaid with blue curves delineating the myocardium). Adapted from (Midgett et al., 2014). WSS: wall shear stress, OFT: outflow tract, V: ventricle, AVC: atrioventricular canal, A: atrium, dpf: days post fertilization.

