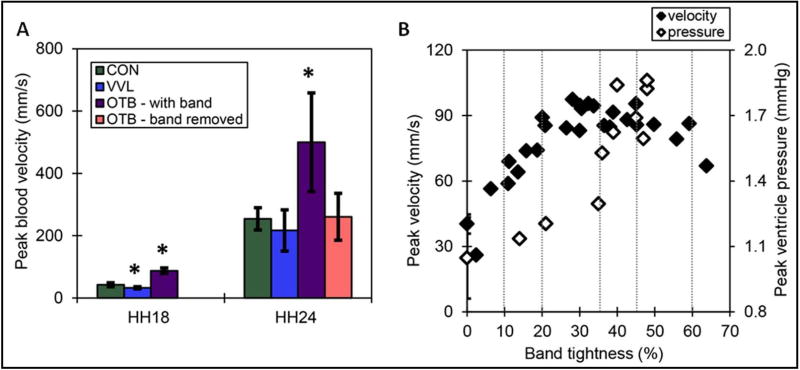
Figure 6. Measured hemodynamics after interventions.
(A) Maximum blood velocity after interventions. Interventions performed at HH18; band removed at HH24. Constriction of banded embryos ranged between 21 and 52% tightness. Standard deviation is displayed as error bars. Asterisk: statistically significant differences between experimental and control embryos (n=8, p<0.05). (B) Altered hemodynamics after outflow tract banding. Hemodynamic response to outflow tract band tightness, produced from previously published data (Shi et al., 2013; Midgett et al., 2014). Vertical lines outline ranges of constriction used for further analysis, and standard deviation of controls are displayed as error bars. CON: surgical sham control, VVL: vitelline vein ligated, OTB: outflow tract banded. Reproduced from (Midgett et al., 2017b).

