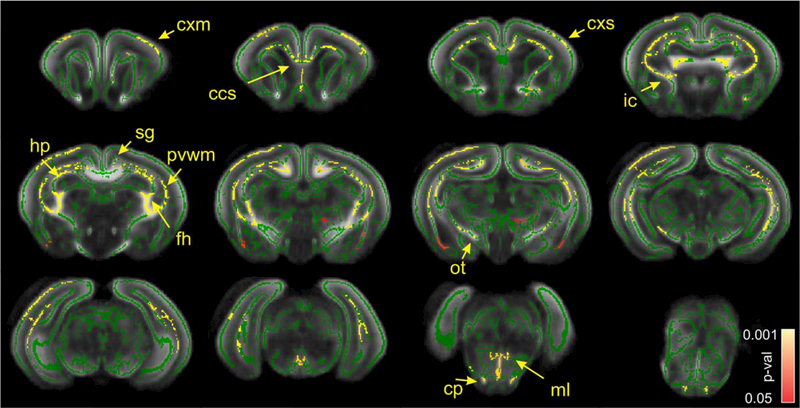
FIGURE 3:
Statistical parametric maps of comparison between sham/nonhypertonic and hypertonic P1 kits after E22 antenatal H-I using FA metric. Green skeleton is overlaid on gray scale FA map. Statistically significant voxels with corrected P-value less 0.05, where FA was less in hypertonic group, are depicted in red–yellow scale. Color bar indicates corrected-P-values range. cxm, cerebral cortex motor; cxs, cerebral cortex sensory; ccs, corpus callosum splenium; ic, internal capsule; sg, singulum; hp, hippocampus; fh, fimbria hippocampi; pvwm, periventricular WM; ot, optic tract; cp, cerebral peduncle; ml, medial lemniscus.

