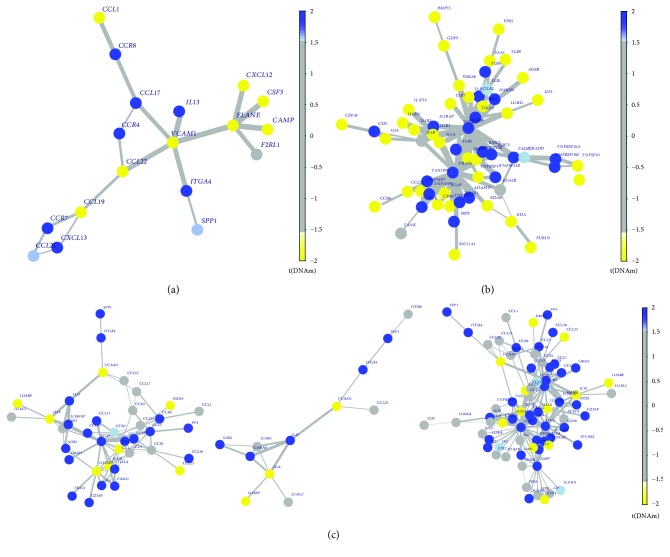
Figure 4.
The hotspots of RA, pSS, and SLE. The yellow dot indicates genes annotated to hypomethylation, and the blue signaled hypermethylated genes to rich. (a) The hotspots centered around seed gene VCAM1 and ELANE from RA dataset. (b) The hotspots MYD88 calculated from dataset pSS. (c) Three CCI networks of SLE: hotspot IL13, CCR5, and IFNG, respectively. DNAm, changes of DNA methylation. Hotspots, the groups or modules calculated from FEM algorithm based on abnormal DNA methylation and protein interaction network.

