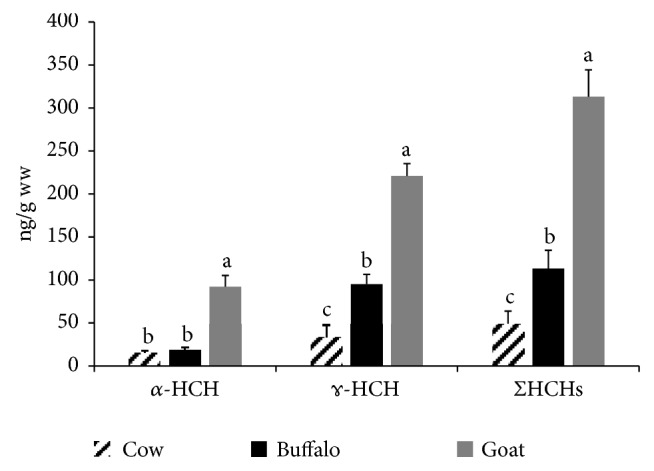
Figure 4.

Total HCH and its isomers' residues in the examined milk samples. Data represent mean ± SE (ng/g ww) for total HCH and its isomers in the examined milk samples from different animal species (n=20 each). Columns that carry different superscript letter among the same chemical are significantly different at p<0.05.
