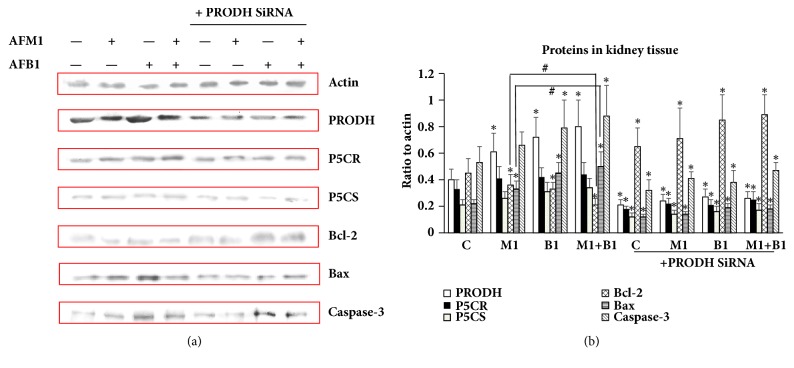
Figure 7.
Detection of PRODH/P5CR/P5CS/Bcl-2/Bax/Caspase-3 in HEK 293 cells by western blotting. (a) Gray bands of PRODH/P5CR/P5CS/Bcl-2/Bax/Caspase-3 in western blotting. (b) Quantification of expression levels of PRODH/P5CR/P5CS/Bcl-2/Bax/Caspase-3 by Image J Software. All the values were represented as mean ± SD, ∗P < 0.05, compared with control; #P < 0.05, compared with the one in (AFB1+AFM1) group (n=8).

