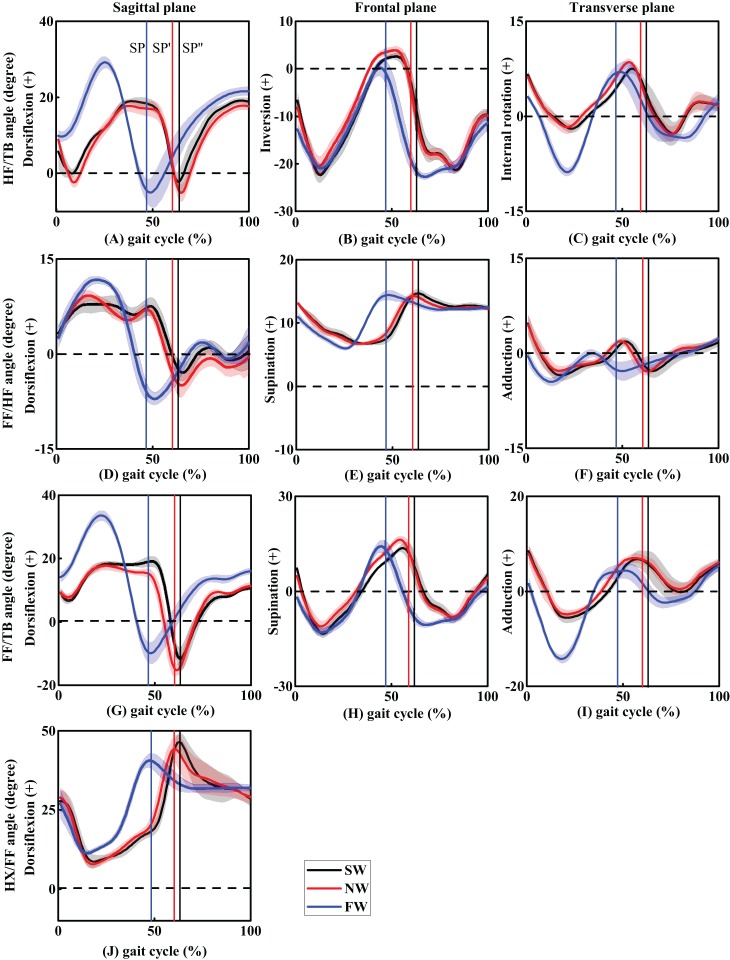
Figure 2. The trend of foot inter-segment kinematics (°) in sagittal, frontal and transverse planes during one gait cycle (A–C, HF/TB; D–F, FF/HF; G–I, FF/TB; J, HX/FF).
Solid line with shade represents mean ± standard deviation across three walking speeds. SP, SP′, and SP″ represents the stance phase of FW, NW, and SW conditions.

