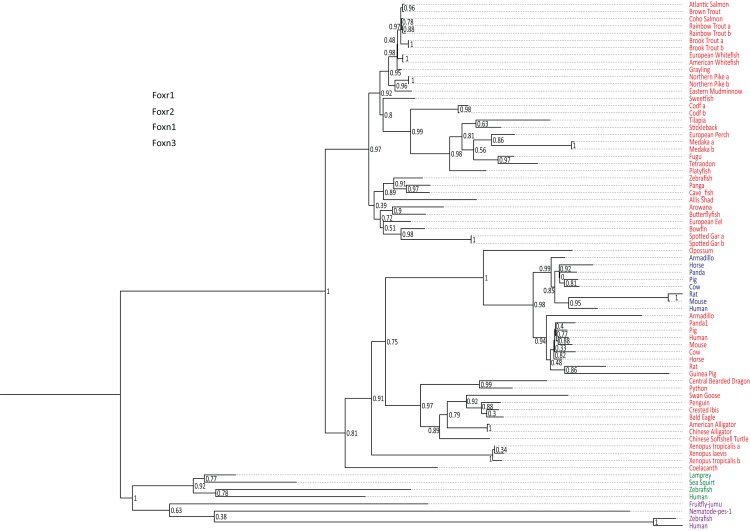
Figure 1. Phylogenetic tree of vertebrate Foxr1 and Foxr2 proteins.
This phylogenetic tree was constructed based on the amino acid sequences of Foxr1 proteins (for the references of each sequence see Data S1) using the Maximum Likelihood method with 100 bootstrap replicates. The number shown at each branch node indicates the bootstrap value (%). The tree was rooted using Foxn1 and Foxn3 sequences. The Foxr1 sequences are in red, Foxr2 sequences are in blue, those of Foxn1 are in green, and Foxn3 sequences are in purple. a and b denotes multiple copies of Foxr1 sequences.

