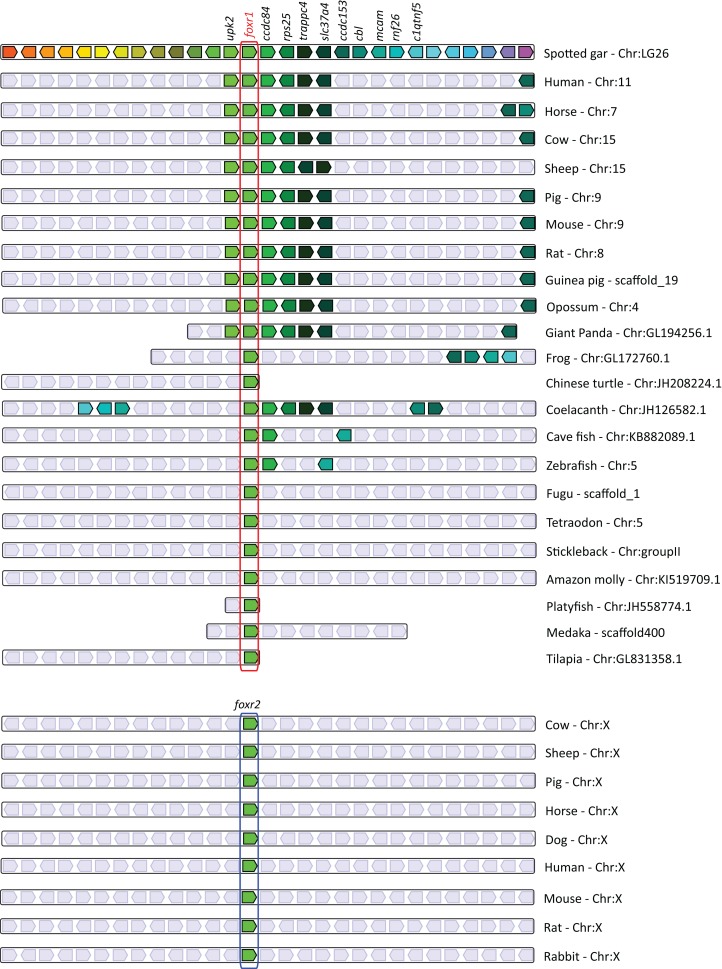
Figure 2. Conserved genomic synteny of foxr1 genes.
Genomic synteny maps comparing the orthologs of foxr1, foxr2, and their neighboring genes, which were named after their human orthologs according to the Human Genome Naming Consortium (HGNC). Orthologs of each gene are shown in the same color, and the chromosomal location is shown next to the species name. foxr1 orthologs are boxed in red while foxr2 orthologs are boxed in blue. Light gray boxes denote the lack of synteny of the corresponding genes in the indicated species as compared to gar.

