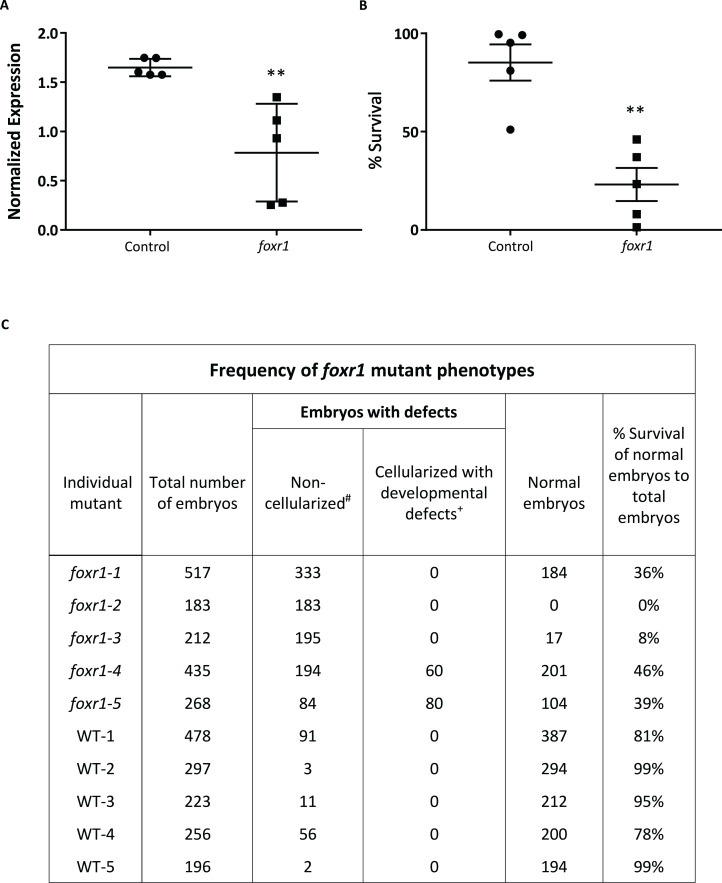
Figure 4. CRISPR/cas9 knockout of foxr1 in zebrafish.
(A) Normalized expression level of foxr1 transcript by quantitative real-time PCR (qPCR) in the fertilized zebrafish eggs from crosses between foxr1 mutant females and vasa::gfp males. (B) Developmental success (% survival) at 24 h post-fertilization (hpf) as measured by the proportion of fertilized eggs that underwent normal cell division and reached normal developmental milestones based on Kimmel et al. (1995) from crosses between foxr1 mutant females and vasa::gfp males. (C) Frequency of foxr1 mutant phenotypes in the F1 eggs between crosses of foxr1 mutant females and vasa::gfp males. #Embryos did not develop at all (please refer to Figs 5E–5H). +Embryos had a partially cellularized blastodisc that was sitting atop an enlarged syncytium (please refer to Figs 5I–5L). The graphs demonstrate representative data from a single clutch from a mutant female. qPCR data were normalized to 18S, β-actin, and ef1α. N = 5 each for foxr1 mutant and control. All assessments were performed from at least three clutches from each mutant. ** p < 0.01 by Mann–Whitney U-test. Control = eggs from crosses of wildtype females with vasa::gfp males; foxr1 = eggs from crosses of foxr1 mutant females with vasa::gfp males.

