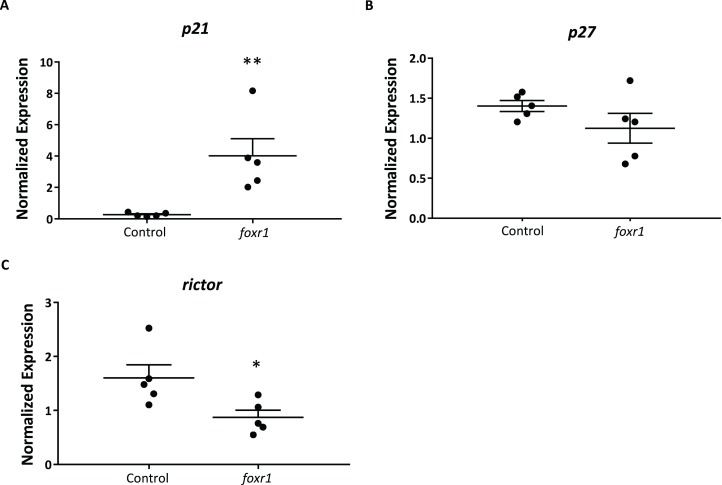
Figure 6. Expression profiles of (A) p21, (B) p27, and (C) rictor in eggs from foxr1 mutant females.
Fertilized eggs from foxr1 mutant females were subjected to qPCR for examination of the transcript levels of p21, p27, and rictor. The graphs demonstrate representative data from a single clutch from a mutant female. Data were normalized to 18S, β-actin, and ef1α. N = 4 each for foxr1 mutant and control, at least two clutches were used from each animal, and each experiment was performed in duplicate. *p < 0.05, **p < 0.01 by Mann–Whitney U-test.

