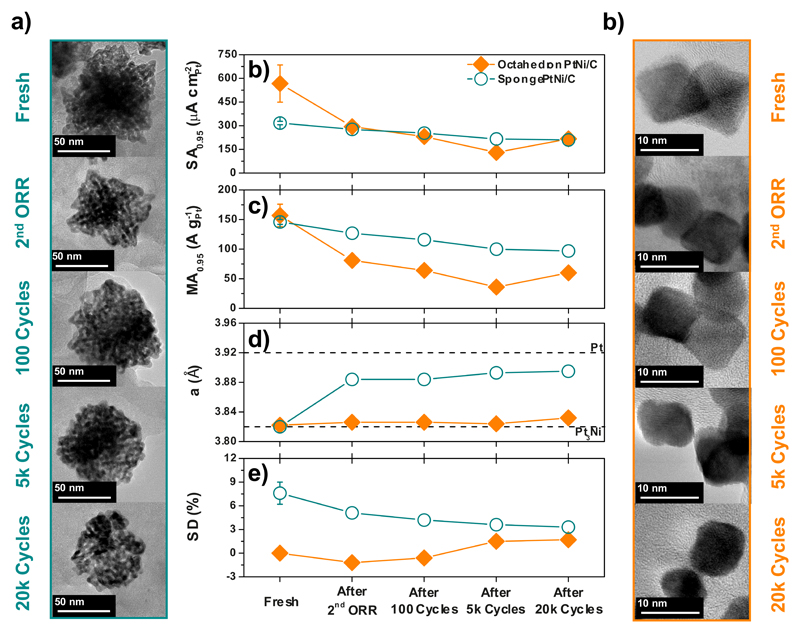
Figure 6. Structural and ORR activity changes under simulated PEMFC cathode environment.
a) STEM images of the Sponge, PtNi/C, b) specific activity c) mass activity, d) lattice parameter and e) SD descriptor of Sponge and Octahedron PtNi/C, and f) STEM images of the Octahedron PtNi/C after various potential cycling stages. The y-axis error bars are the same as those defined in Fig. 4.

