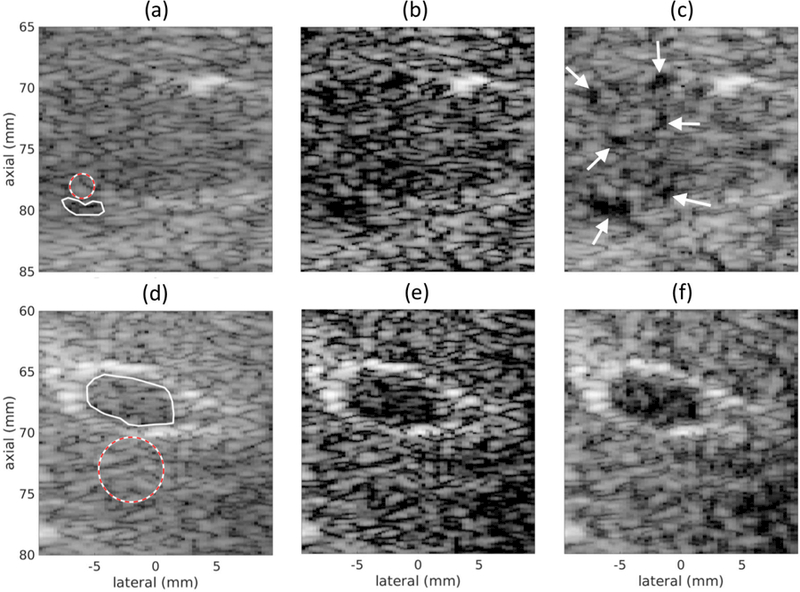
Fig. 11.

In vivo scans of human liver using (a, d) DAS, (b, e) CF, and (c, f) DNNs. The regions used to compute CR, CNR, and SNRs recorded in Table VI are shown in (a) and (d). The region with a solid line indicates the inside region and the region with a dashed line indicates the background region. Images are shown with a 60 dB dynamic range.
