Fig. 17.

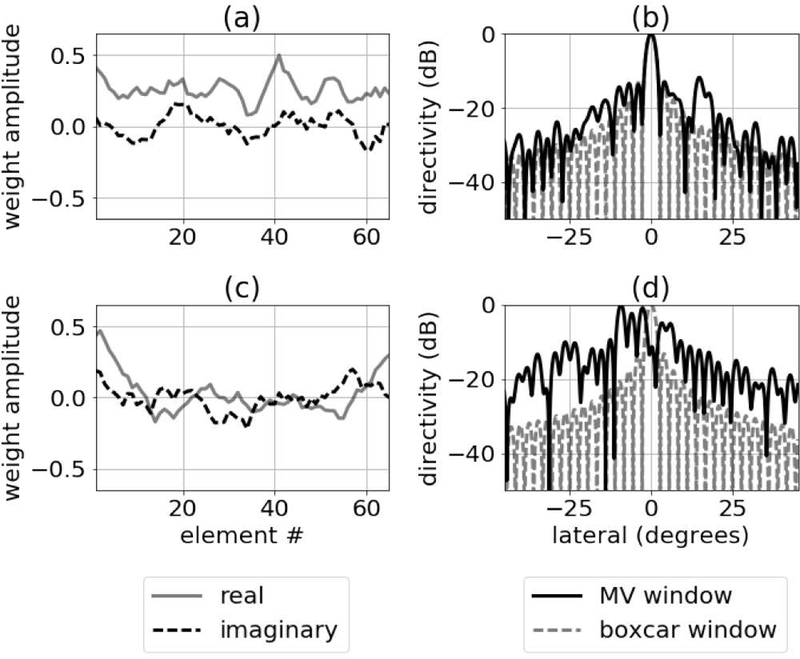
Complex apodization weights computed using minimum variance beamforming are in the left column for (a) an anechoic cyst and (c) a region of diffuse scattering. Corresponding beam profiles are in the right column.

Complex apodization weights computed using minimum variance beamforming are in the left column for (a) an anechoic cyst and (c) a region of diffuse scattering. Corresponding beam profiles are in the right column.