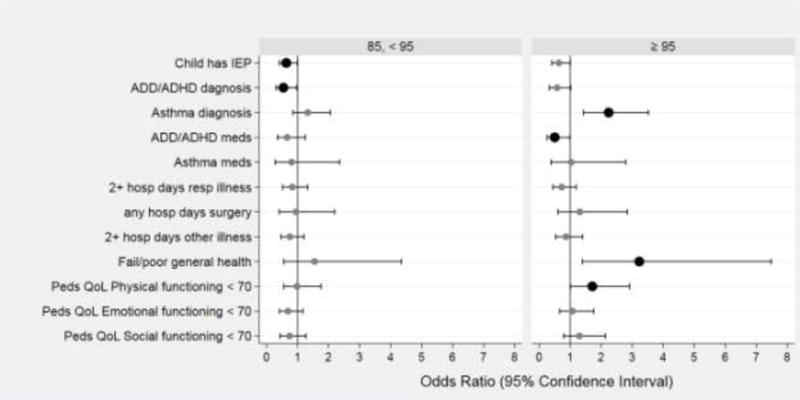
Figure 2.

Forest plots of odds ratios (ORs) and 95% confidence intervals of several educational and health characteristics associated with BMI centile at 10 years 85 to < 95 (left panel) and ≥ 95 (right panel). The reference group is children from the same cohort with BMI centile at 10 years <85. Odds ratios are adjusted for maternal Hispanic ethnicity, education ≤ 12 years, single marital status, and pre-pregnancy BMI < 25 and 25 to < 30; and child’s sex and birth weight Z-score < −1. Statistically significant items are bolded.
