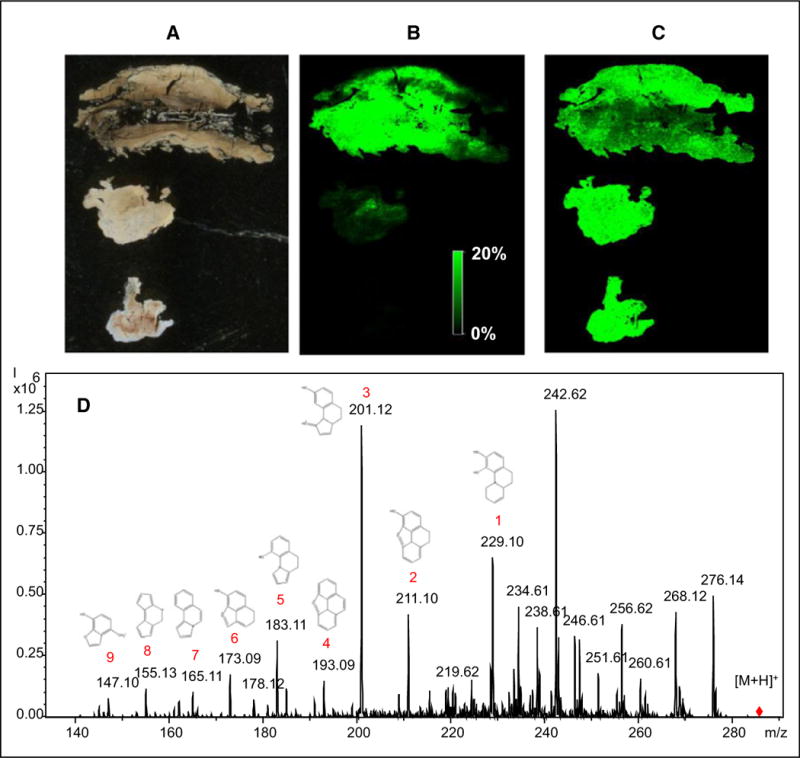
Figure 3.

Mass spectral analysis of intradural granuloma tissue fragments. (A) Unstained tissue fragments. (B) Matrix-assisted laser desorption ionization–mass spectrometry imaging (MALDI-MSI) for 286.144 ± 0.001 Daltons (m/z), corresponding to morphine. (C) MALDI-MSI of 289.163 m/z ± 0.001, corresponding to morphine-D3 internal standard. (D) Liquid extraction surface analysis–tandem mass spectrometry of intradural granuloma tissue. Product ion mass spectrum from parent mass 286.1 (m/z) using collision-induced dissociation along with proposed chemical structures corresponding to mass spectral peaks.
