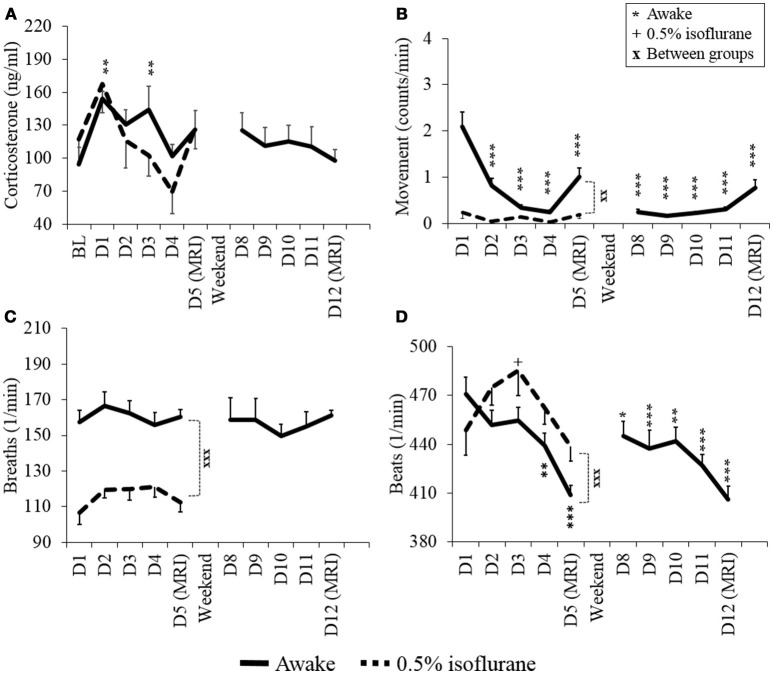
Figure 3.
Stress level indicators of plasma corticosterone (A), movement (B), respiratory rate (C), and heart rate (D) of awake and lightly sedated rats during habituation and fMRI. Mean values ± SEM of corticosterone (ng/ml), movement (counts/min), respiration (breaths/min) and heart rate (beats/min) are presented (n = 7–8 in each group). Statistical testing between days was done with ANOVA for repeated measures and Dunnett's post-hoc test, and between groups with a two-sample t-test. Significant differences of each time point are co mpared to either BL (A) or D1 (B–D) values. One symbol equals p < 0.05, two symbols equal p < 0.01, three symbols equal p < 0.001.

