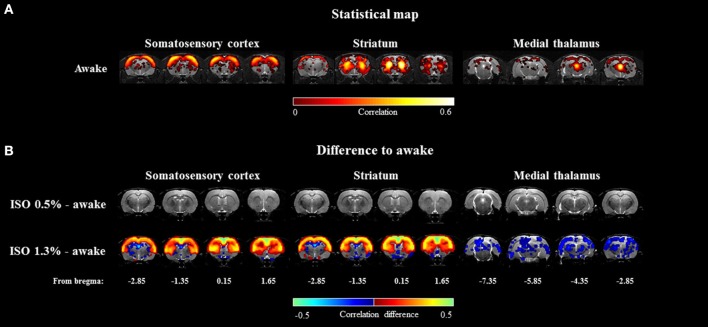
Figure 5.
The group-level seed-based statistical correlation maps obtained from the awake group (A) and group-level differences compared to the awake group (B) obtained from three representative brain regions. Brain regions of somatosensory cortex, striatum, and medial thalamus were selected. Statistically significant voxels were obtained with one-sample t-test (A) (p < 0.001) and two-sample t-test (B) (p < 0.05).

