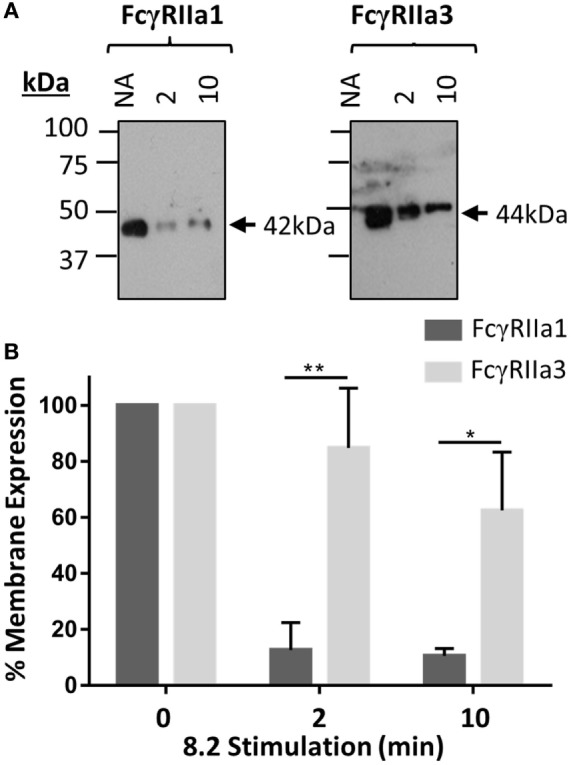
Figure 3.

Time course of receptor expression at the plasma membrane following mAb (8.2) stimulation. (A) Western blot analysis of FcγRIIa precipitated from cells after stimulation with the non-blocking agonist FcγRIIa mAb 8.2 (20 µg/mL) at 37°C for the indicated time (minutes). Membrane fractions were isolated, receptor immunoprecipitated using IgG-conjugated beads, and subsequently probed using rabbit anti-FcγRIIa anti-sera. Molecular markers and size of FcγRIIa1 (42 kDa) and FcγRIIa3 (44 kDa) are indicated. (B) Densitometry of FcγRIIa1 and FcγRIIa3 intensity from three independent Western blot experiments. Intensity of FcγRIIa immunoprecipitation from unstimulated (no addition = NA) cells in each blot is taken as 100% (mean ± SEM, n = 3).
