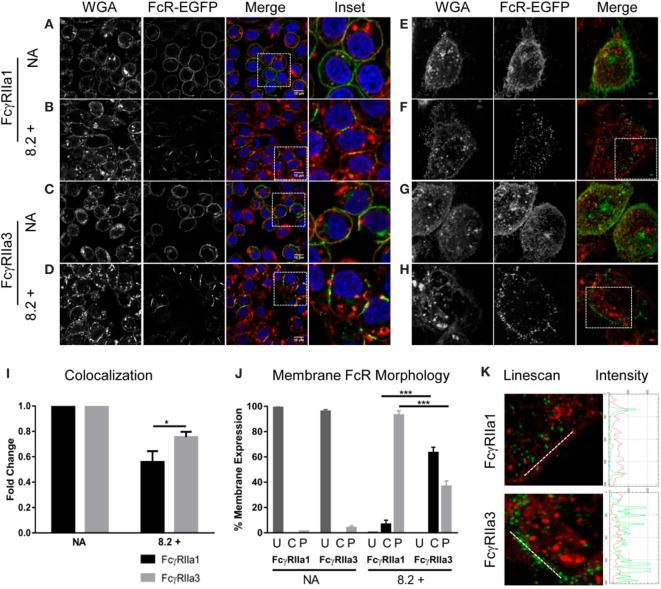
Figure 4.
Receptor distribution following stimulation. Panels (A–D) are focal plane confocal images of z-series (scale bars 10 µm) and panels (E–H) are representative 3D maximum intensity projection of N-SIM super resolution images (scale bars 5 µm) of RBL cells expressing FcγRIIa1–EGFP or FcγRIIa3–EGFP (green). Cells were untreated (no addition/NA) [panels (A,C,E,G)] or stimulated with mAb 8.2 (30 µg/mL) for 5 min at 37°C [panels (B,D,F,H)]. The plasma membrane was stained using wheat germ agglutinin (WGA) AlexaFluor-633 (red) and the nucleus stained using Hoechst 33258 (blue). Cells were imaged in PBS at room temperature using a Nikon A1 + -SI laser scanning confocal or N-SIM microscope and analyzed using the open source Java application ImageJ (see Materials and Methods). Panel (I) shows Pearson’s correlation coefficient (r) calculated for FcγR and WGA colocalization and normalized for resting state (NA) to represent the fold change in membrane and receptor colocalization (n = 3, 10 z-stacks per experiment). Panel (J) shows proportion of cells displaying cap or punctate membrane structures determined by blind-counting 100 cells prior to addition (NA) or following 5 min stimulation with mAb 8.2 (mean ± SEM, n = 3, 100 cells counted per experiment). Receptor distribution was defined as U = uniform, C = condensed caps, P = punctate morphology (defined in Figure S2 in Supplementary Material). Panel (K) Linescan, profiles across membrane segments from stimulated cells as in (panel F and G above). Linescan shown by white line in (left) panels and the corresponding intensity profiles of FcγR (green) and plasma membrane (red) (right).

