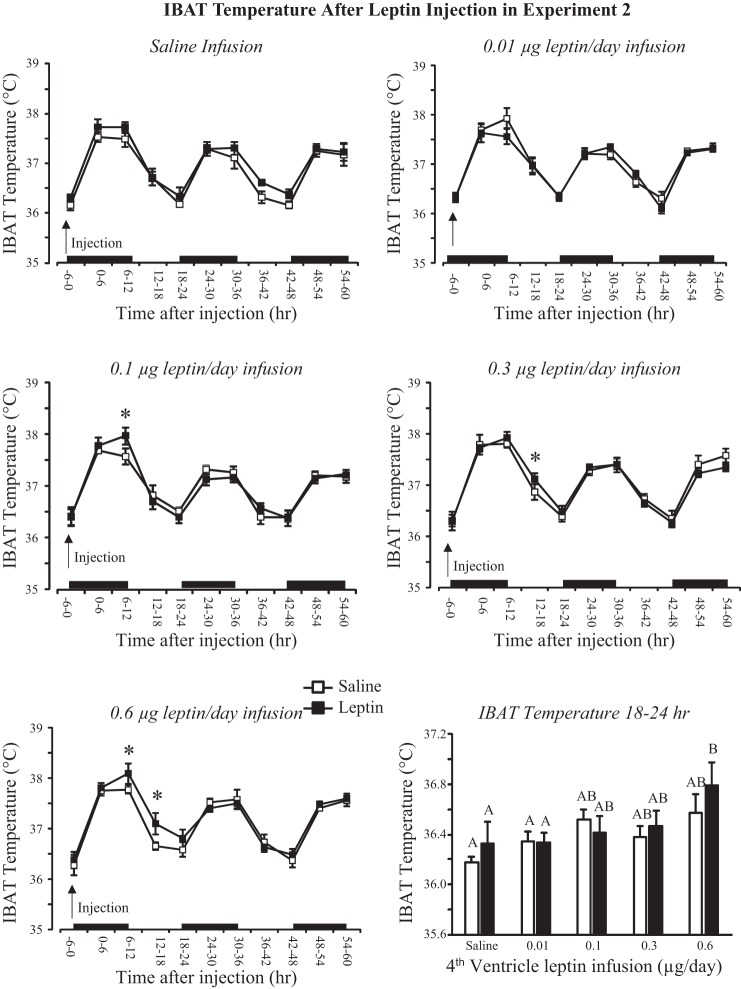
Fig. 6.
Intrascapular brown fat (IBAT) temperature of rats in experiment 2 during the 60 h following a third-ventricle injection of either saline or 0.1 μg leptin. *Significant elevation in temperature following leptin injection. Average temperatures between 18 and 24 h that do not share a common letter are significantly different at P < 0.05. Data are means ± SE for groups of 6–10 rats. Black bars indicate the dark phase of the light cycle.

