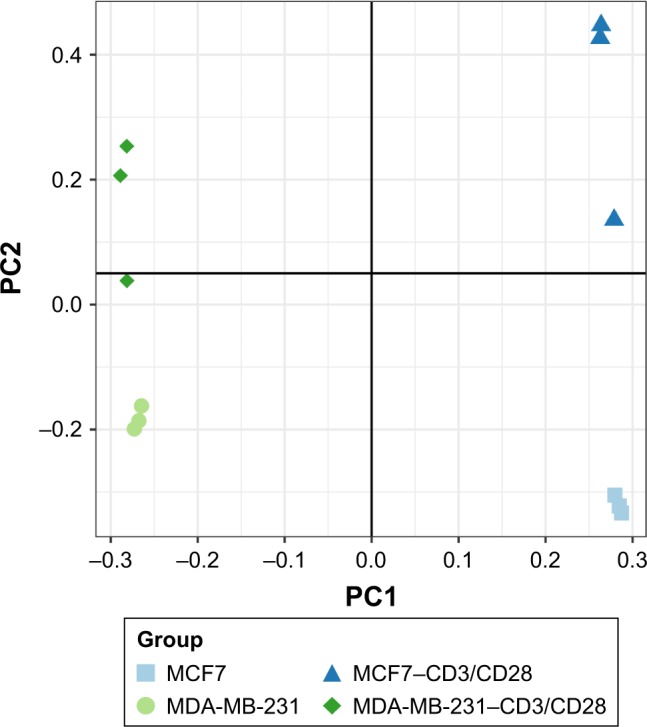
Figure 1.

Principal component analysis of samples in different groups.
Notes: The X-axis and the Y-axis represent the different dimensions of the two clusters. The more obvious the clustering, the better the stability of the experiment and higher the reliability of the data.
