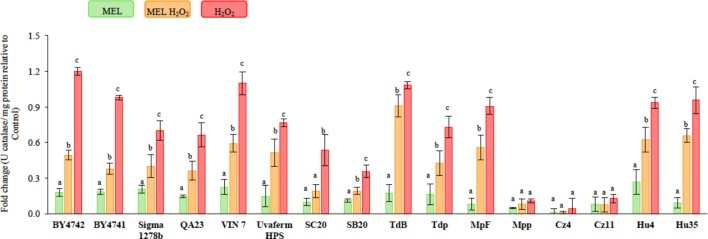
FIGURE 3.
Catalase activity in unstressed and stressed yeast cells with 2 mM of H2O2, growing with and without 5 μM of melatonin (MEL). The strains used were: S. cerevisiae (BY4742, BY4741, Sigma 1278b, QA23, VIN 7, SC20, SB20, and uvaferm HPS), T. delbrueckii (TdB and Tdp), M. pulcherrima (MpF and Mpp), C. zemplinina (Cz4 and Cz11), and H. uvarum (Hu4 and Hu35). The error bars represent ± SD of n = 3 by ANOVA. Different letters indicate significant differences between conditions within each strain, p < 0.05.

