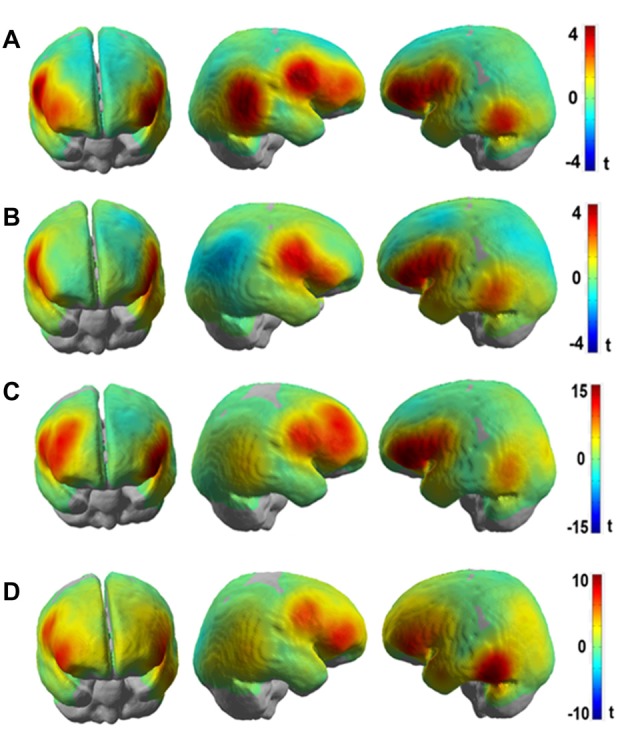
Figure 6.

t-value maps obtained from channel-wise linear regression of (A) HbR and (B) HbO fNIRS data for the group-level analyses and channel-wise linear regression of (C) HbR and (D) HbO fNIRS data for single participant (P8, same participant as in Figure 5) for the (Frust- noFrust) condition using Generalized Linear Model (GLM). High positive t-values are indicated by red color, high negative values by blue color. Note that the activation of HbO and HbR maps are in the same direction in spite of the signals being negatively correlated, because the hemeodynamic response function was reversed for estimating the GLM co-efficients for HbR.
