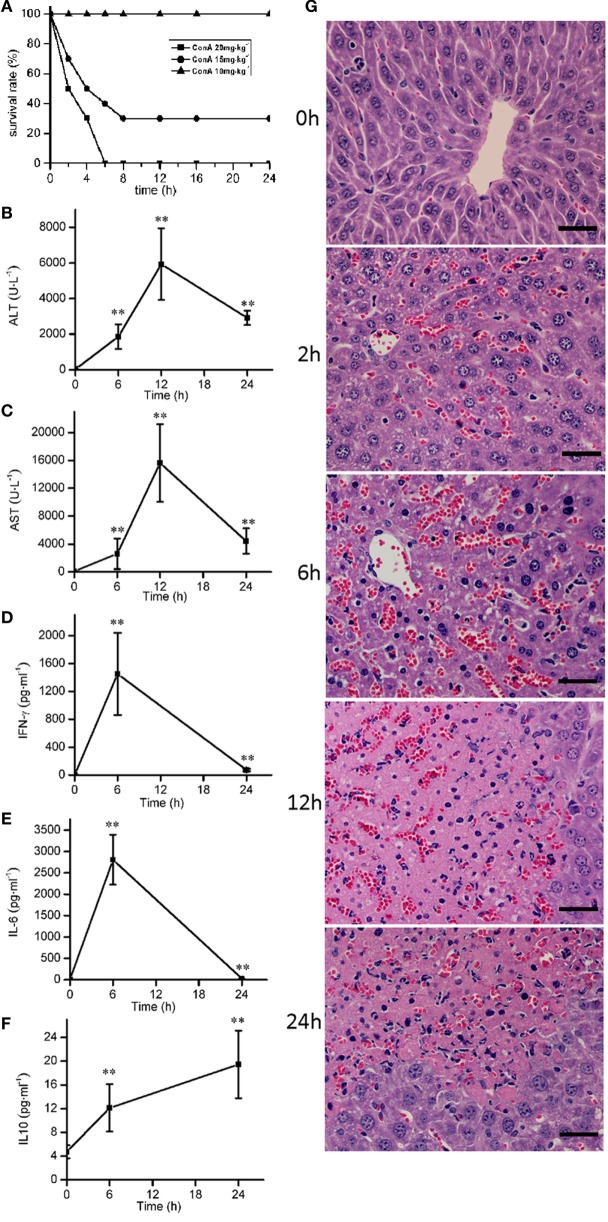
Figure 1.
The time course of pathological, blood chemical, and cytokine changes in ConA-induced hepatitis. (A) The survival rates were decreased with the increase of ConA. (B,C) The serum levels of alanine transaminase, aspartate transaminase after ConA (10 mg⋅kg−1) administration. (D–F) The changes of serum levels of IFN-γ, IL-6, and IL-10 after ConA (10 mg⋅kg−1) administration. (G) Representative micrographs depicting H&E stained hepatic sections observed under 40× objectives after ConA (10 mg⋅kg−1) administration. Scale bars, 50 µm. Mice were administered with a single intravenous injection of saline containing ConA. The mice treated with intravenous injection of normal saline only were used as control (time 0 h). Error bars indicate mean ± SD. **P < 0.01 compared with control group (n = 6).

