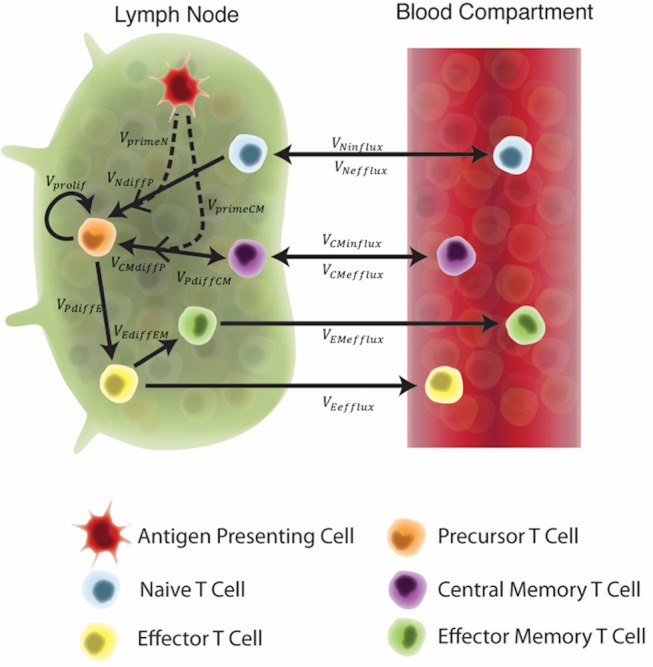
Figure 2.

Schematic of the two-compartment model. Each equation represents a concentration of a particular cell type, as outlined in the legend. These concentrations are dependent on other cell concentrations and interactions (as shown by arrows) between cells or compartments. Arrow labels are defined in greater detail in Supplementary Materials 1. Briefly, VprimeN and VprimeCM represents the impact of APCs on naïve and central memory cell recruitment. VNdiffP and VCMdiffP shows the transformation of naïve and central memory T cells to the precursor T cell population. Vprolif, VPdiffE, VPdiffCM, and VEdiffEM represents precursor proliferation and differentiation to effector, central memory and effector memory cell types, respectively. Finally, influx and efflux rates between LN and blood are shown as VNinflux, VCMinflux, VCMefflux, VEefflux, and VEMefflux.
