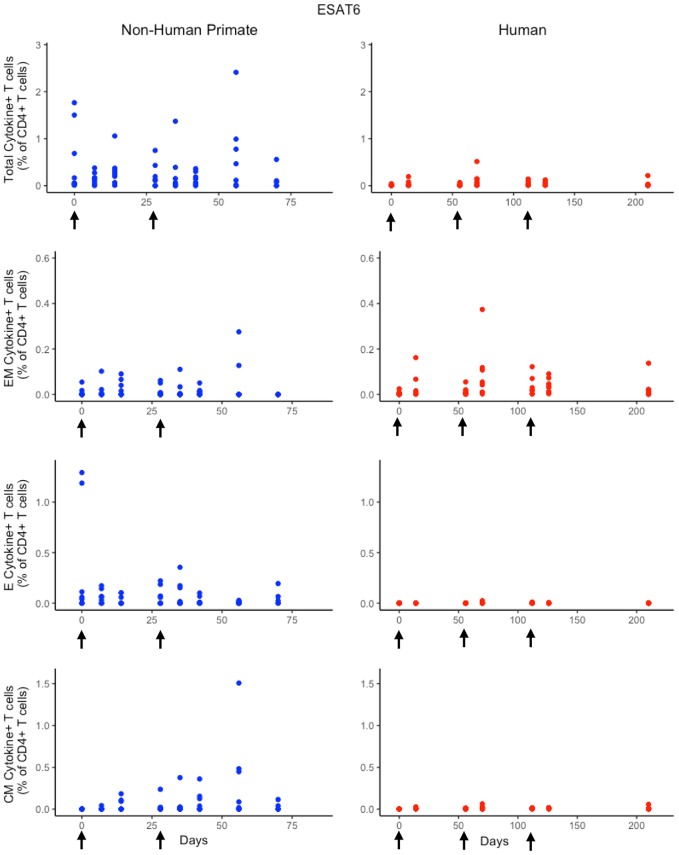
Figure 3.
Experimental data show different responses to ESAT6 antigen following H56 vaccination. The percentage of blood CD4+ T cells that respond to ESAT6 by producing cytokines (cytokine+) is divided by the total number of CD4+ T cells in the blood. T cell subtypes are also shown. Each time point shows the responses of all 8 human (red) or all 8 NHPs (blue) subjects. Note that it can be difficult to perceive 8 individual dots–if the subject's responses are similar or the same, as individual dots overlap. For ease of comparison, we have placed both panels of data on the same y-axis. Arrows represent vaccination timepoints.

