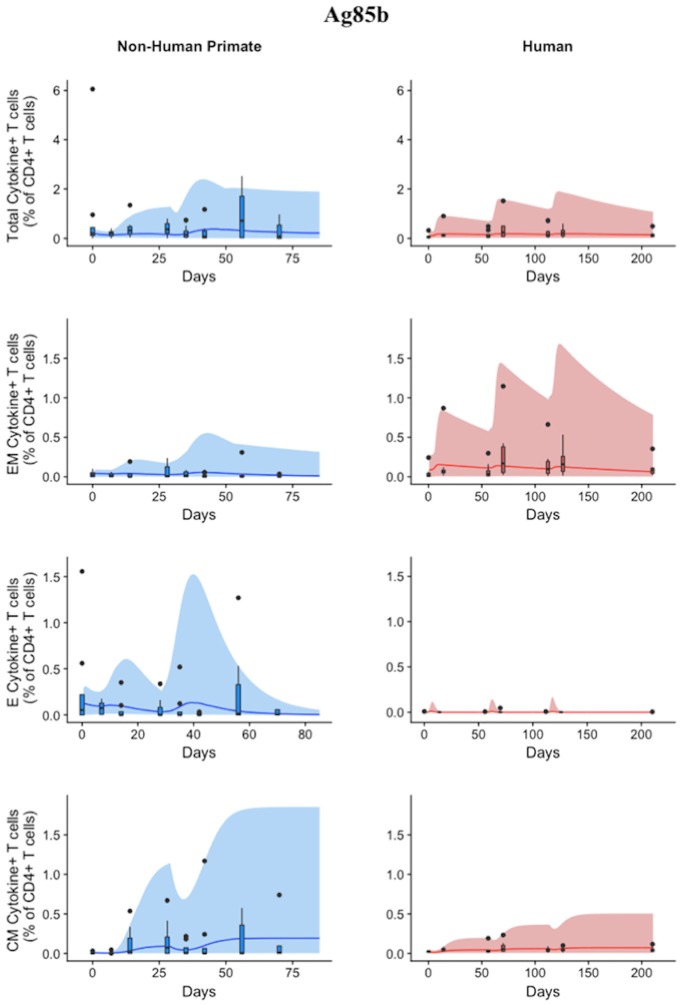
Figure 6.
Model can fit diverse responses of both NHP and Humans to Ag85B antigen following H56 vaccination. The percentage of blood CD4+ T cells that respond to Ag85B by producing cytokines (cytokine+) is divided by the total number of CD4+ T cells in the blood. T cell subtypes are also shown. Each time point shows the responses of all 8 human (red) or all 8 NHPs (blue) subjects as a box and whisker plot. Whiskers were created in the same manner as the ESAT6 datasets. Simulation data are displayed as a blue or red cloud that outline the min and max of 500 runs for NHP or human calibrations, respectively. The blue or red line represents the median of those simulations and demonstrates that the model captures the general behavior of the data, by traveling through the interquartile range of at least 4 of the 8 timepoints for each subpopulation of T cells. Exact parameters ranges used to generate the simulation curves for NHP and human CD4+Ag85B+ T cells are shown in Supplementary Table 1.

