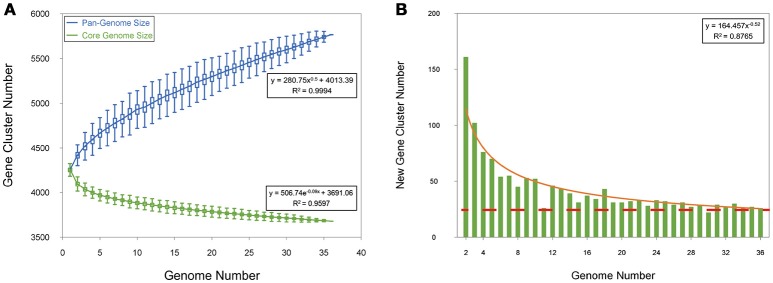
Figure 1.
Pan-genome of Mtb. (A) Gene accumulation curves of the pan-genome (blue) and core-genome (green). The blue boxes denote the Mtb pan-genome size for each genome for comparison. The green boxes show the Mtb core genome size for each genome for comparison. The curve is the least squares fit of the power law for the average values. (B) Curve (red) for the number of new genes with an increase in the number of Mtb genomes.

