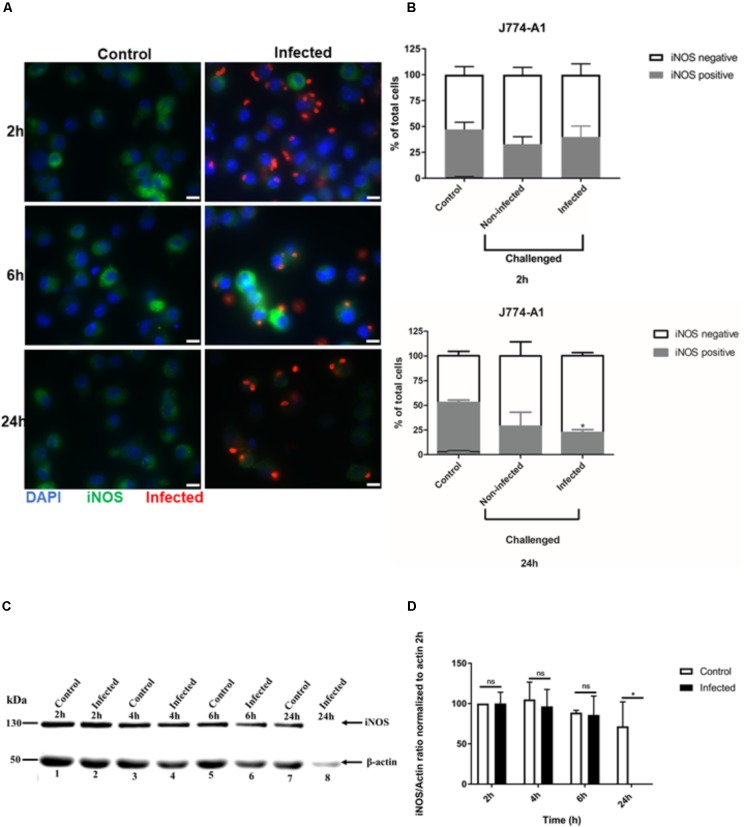
FIGURE 2.
Immunofluorescence detection of iNOS in activated J774-A1 macrophages infected with T. gondii. (A) Detection of iNOS (green) in non-infected (Control) and in T. gondii (red) infected cells (DAPI - blue) at 2, 6, and 24 h post-infection. Scale bar = 10 μm. (B) Analysis of the proportion of iNOS positive or negative macrophages in non-infected (Control) and T. gondii infected cells at 2 and 24 h post-infection. Mean ± SEM (n = 4 experiments, each with 8 replicates). (C) Western blot detection of iNOS expression in non-infected (Control) and T. gondii infected (Infected) cells. β-actin was used as loading control. (D) Densitometry of western blots normalized to β-actin at 2 h post-infection. Mean ± SD (n = 3 experiments, each with 1 replicate). ∗P ≤ 0.05, two-way ANOVA with Tukey post-test, n.s (not significant).

