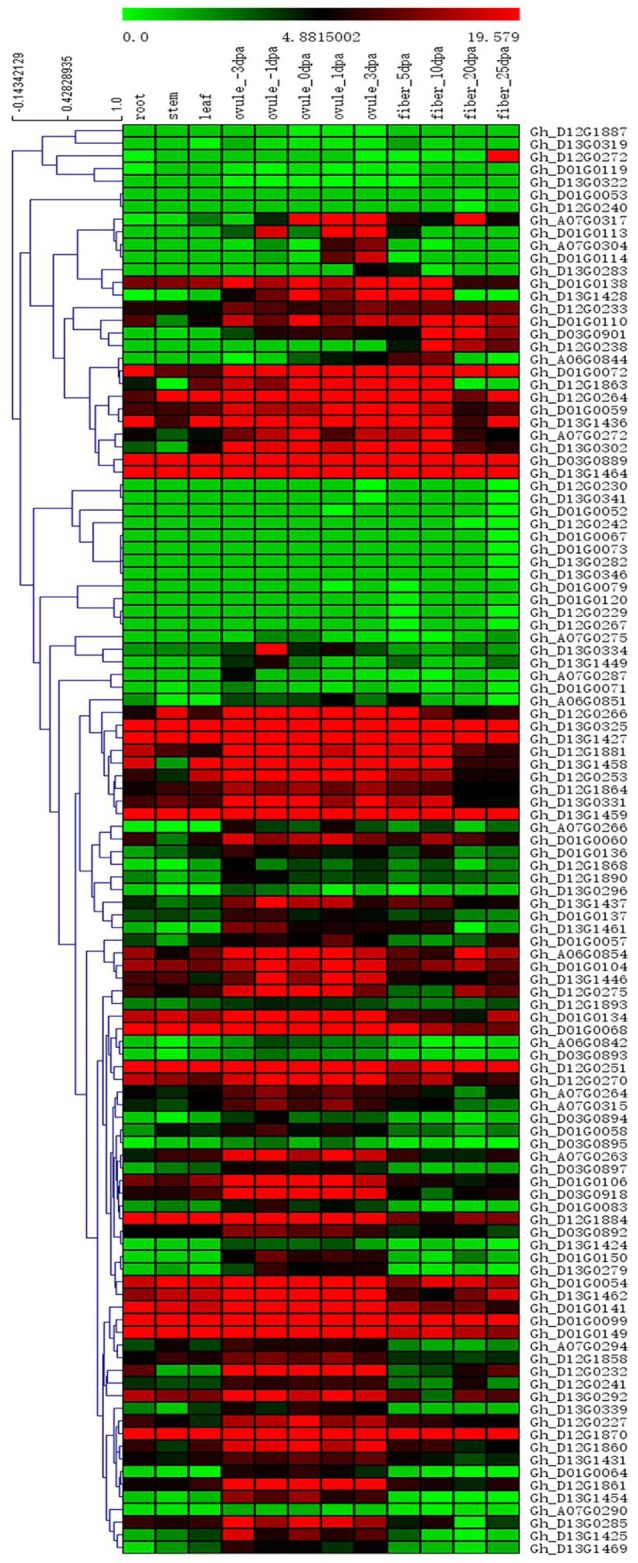
Figure 4.

Heatmap of expression patterns of 113 genes with hierarchical clustering based on FPKM values. These genes presented higher expression levels in ovules and/or fiber during their developmental stages, while being less expressed in root, stem, and leaf. The values in the horizontal color bar are automatically generated in Mev 4.9 according to the FPKM values; red indicates high expression, and green indicates low expression.
