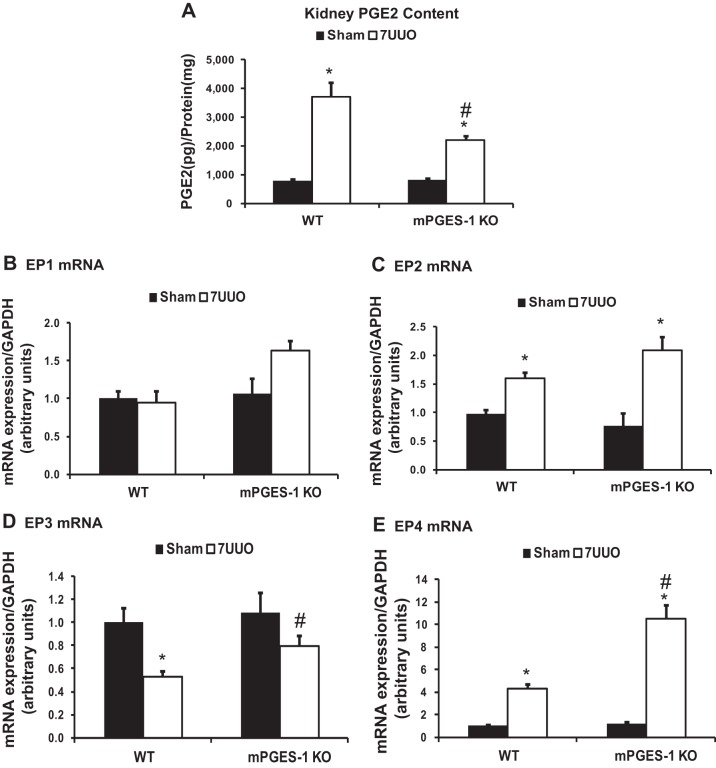
Fig. 3.
Renal PGE2 content and mRNA expression levels of EPs in obstructed kidneys of mPGES-1 WT mice and KO mice. A: renal PGE2 production measured by ELISA. B–E: analysis of mRNA expression by quantitative real-time PCR for EP1 (B), EP2 (C), EP3 (D), and EP4 (E) in obstructed kidneys of mPGES-1 WT and KO mice. WT-Sham, n = 6; WT-7UUO, n = 7; KO-Sham, n = 6; KO-7UUO, n = 7. *P < 0.05 compared with Sham groups. #P < 0.05 compared with WT-7UUO.

