
Fig. 2.
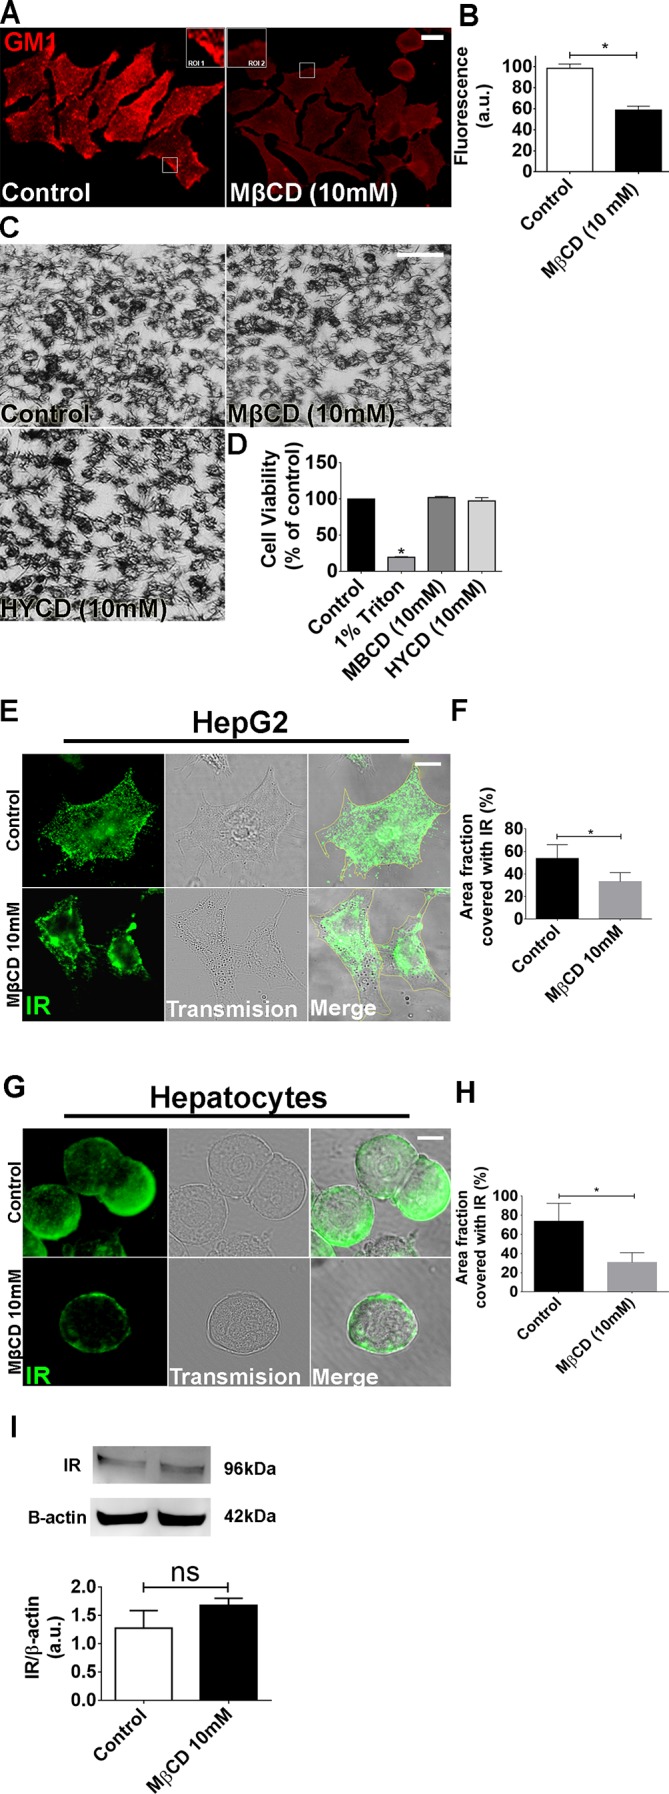
Metyl-β-cyclodextrin (MβCD; 10 mM) treatment efficiently disrupts the lipid rafts without compromising cell viability. A: control and MβCD (10 mM)-treated HepG2 cells were labeled with CTxB to identify the lipid rafts. Regions of interest (ROI 1 and 2) show a zoom of the GM1 labeling in certain membrane areas. B: quantification of fluorescence intensity of A [control cells: 98.65 ± 4 arbitrary units (a.u.) vs. MβCD-treated cells: 58.8 ± 3.7 a.u.; *P < 0.05; n = 159 cells analyzed for each group]. C: bright-field images of MTT assay show cellular viability of control, MβCD, and (2-hydroxypropyl)-γ-cyclodextrin (HYCD)-treated cells. D: quantification of MTT assay in C. 1% Triton was used as a positive control of the technique (control: 100 ± 0%; Triton-X: 19.63 ± 0.4%; MβCD: 97.41 ± 2.3%; HYCD: 102.2 ± 0.7%; *P < 0.05; n = 3 individual experiments). E: Z-stack of control and MβCD-treated HepG2 cells immunostained for the insulin receptor (IR) (green). F: quantification of delimited (yellow traces) cell area covered with IR in HepG2 cells (n = 55 cells of 3 different experiments for each group were analyzed). G: Z-stack of control and MβCD-treated hepatocytes immunostained for IR (green). H: quantification of delimited (yellow traces) cell area covered with IR in hepatocytes (n = 55 cells of each 3 different experiments were analyzed; *P < 0.05; values expressed as means ± SD). I: immunoblots for IR shows that there is no difference in the expression of IR between control and MβCD-treated HepG2 cells (control: 1.25 ± 0.27 vs. MβCD: 1.53 ± 0.11; n = 3 individual experiments). The values indicate the means ± SD. *P < 0.05, difference between groups was statistically significant; ns, not significant. Data were analyzed by one-way ANOVA followed by Bonferroni posttests.