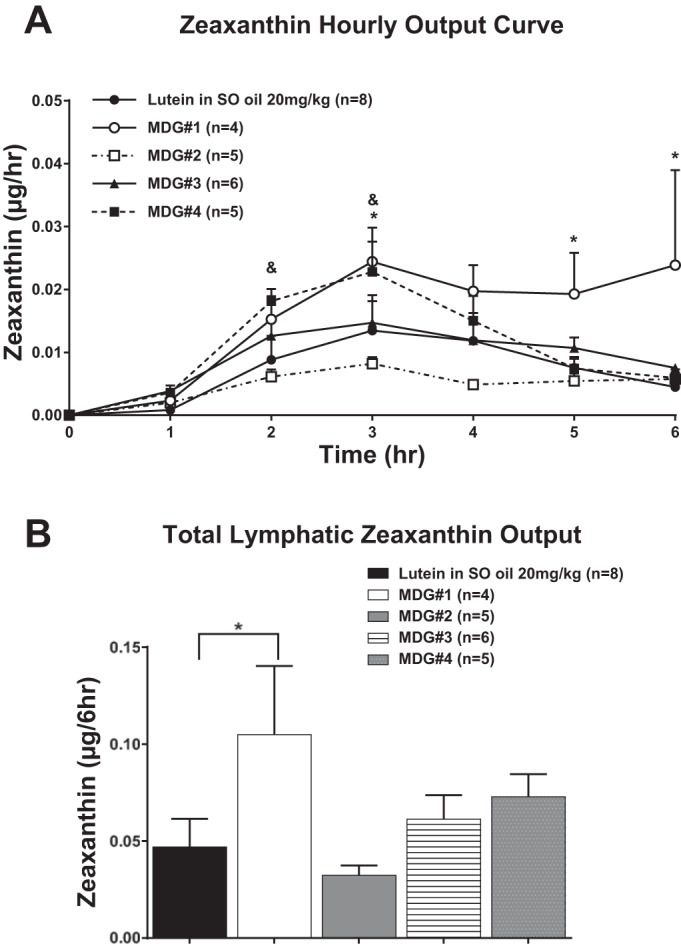
Fig. 6.

A: total lymphatic zeaxanthin output expressed as μg/h. Zeaxanthin concentrations were measured in lymph 1 h before (fasting) and hourly for 6 h after lutein infusion. The 5 groups of animals studied are the same as in Fig. 5. B: total lymphatic zeaxanthin output over the 6-h lutein infusion period (area under the curve) for the same 5 groups of animals shown in A. Values are means + SE. *MDG 1 vs. lutein in SO, +MDG 3 vs. lutein in SO, and &MDG 4 vs. lutein in SO.
