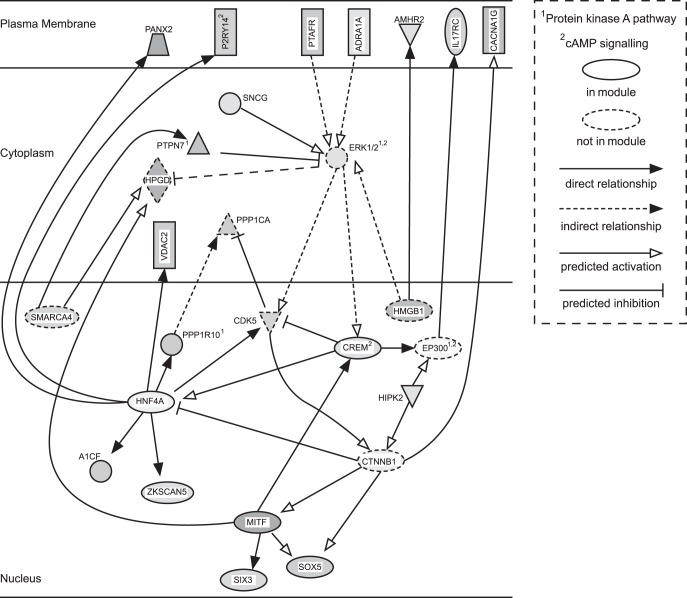
Fig. 3.
IPA pathway analysis network for the cAMP/PKA module. Genes not in the cAMP/PKA module have shapes outlined in dashed lines. Fill is proportional to fold change from the microarray data (darker = greater fold change), and all are upregulated except for P2RY14. Figure generated using IPA (Qiagen, Valencia, CA).

