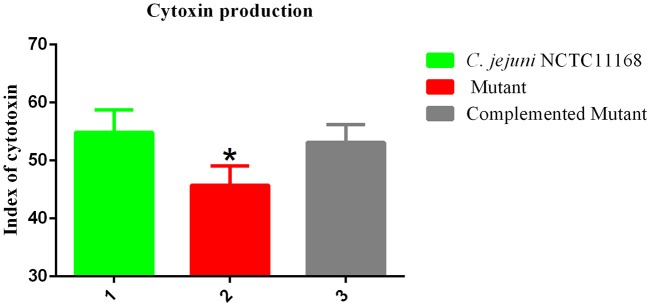
Figure 5.
Cytotoxic production of the C. jejuni NCTC11168 and Δcas9 mutant in murine macrophage RAW264.7 cells. The Y axis is the index of cytotoxic production of each strain. The results were obtained from three independent repeats. One asterisk (*) indicates a statistically significant difference at P ≤ 0.05 between C. jejuni NCTC11168, complemented, and the Δcas9 mutant.

