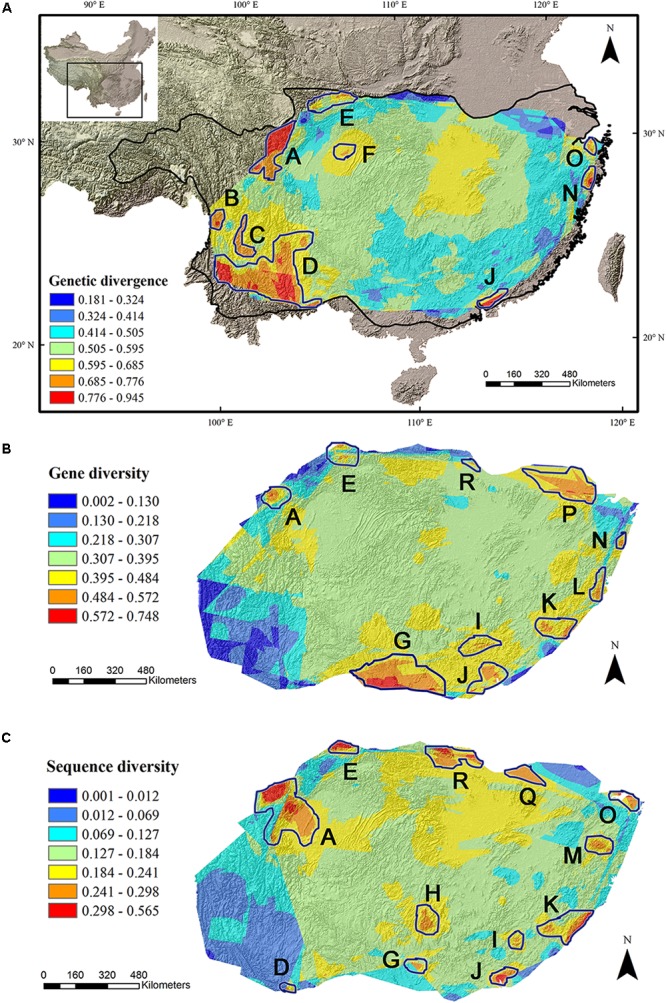
FIGURE 1.

Multi-species genetic landscape for genetic divergence (A), gene diversity (B) and sequence diversity (C) across subtropical China. The three genetic diversity indices range from its highest values in red to its lowest values in blue. By comparing the hotspots among the three landscapes, those hotspots belonging to the same geographic area were numbered identically. The black line in (A) shows the boundary of subtropical evergreen broadleaved forest in mainland China (adapted from Zhang et al., 2007).
