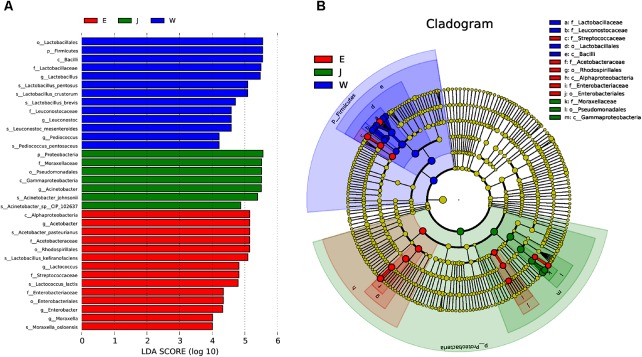
FIGURE 5.
The microbial communities of Rushan cheese samples from Weishan (W), Eryuan (E), and Jianchuan (J) were analyzed using LDA Effect Size (LEfSe) algorithm to determine the optimal characteristic taxa and rank them according to the effect size (A). The cladogram obtained from LEfSe analysis shows the dominant taxa (highlighted by small circles and by shading) in Rushan cheese samples (B).

