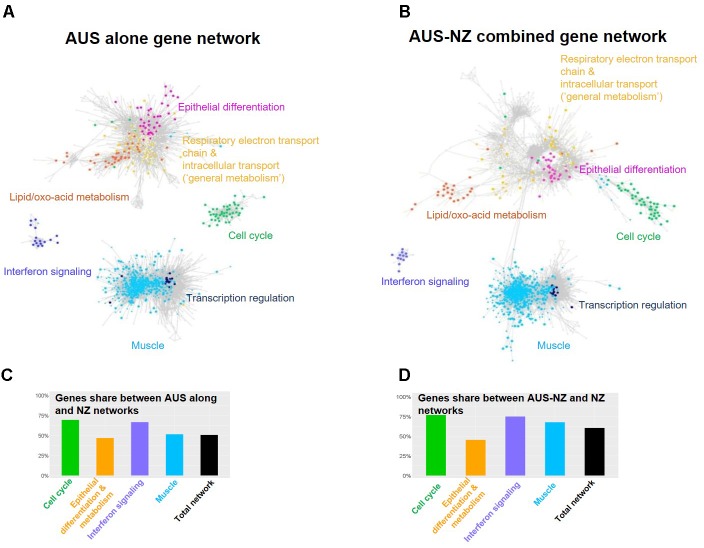
FIGURE 1.
Relationships between transcriptomes from the AUS and NZ animals. Transcriptome networks based on AUS alone (A), and AUS-NZ combined (B) data, with genes included in the major clusters of the networks and identified in the previously generated NZ network (Xiang et al., 2016a) indicated (Supplementary Figure S3). The networks were built based on correlation of voom normalized gene expression (Law et al., 2014). For the AUS-NZ combined data (B), quantile normalization was used to remove non-biological variations (Bolstad et al., 2003). (C) The percentage of genes in the AUS network and in each major cluster of the AUS network that were included in the NZ network and major gene clusters. (D) The percentage of genes in the AUS-NZ combined network and in each major cluster of the AUS-NZ combined network that were included in the NZ network and major gene clusters.

