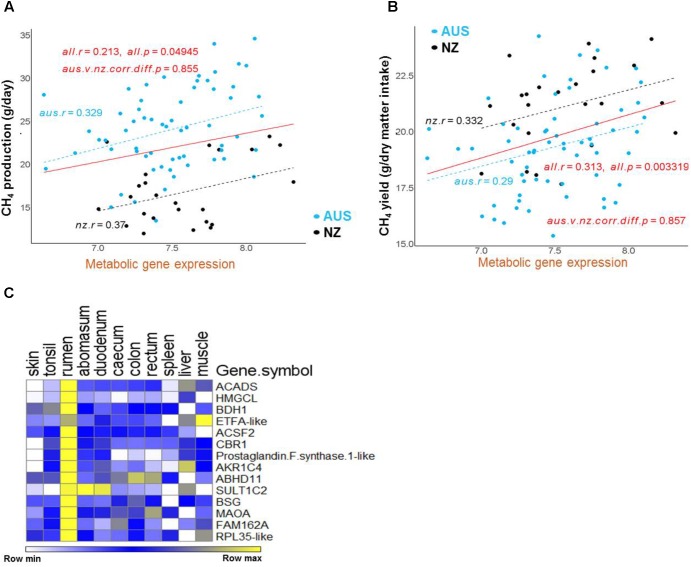
FIGURE 5.
Regressions of CH4 production and yield on the expression of the metabolic gene set in the AUS and NZ experiments. (A,B) Correlation regressions between the mean expression of the metabolic gene set and CH4 production (A) or CH4 yield (B) in each animal. The mean expression of the set of genes in each gene cluster for each animal was calculated from the normalized gene expression values for each gene in each animal generated by normalizing the AUS and NZ datasets together. The significance of between-experiment difference of correlations of mean gene cluster expressions is indicated in the relevant panel. (C) The heatmap of the metabolic gene set expression using data from the sheep RNA-seq atlas (Xiang et al., 2016b).

