FIGURE 7.
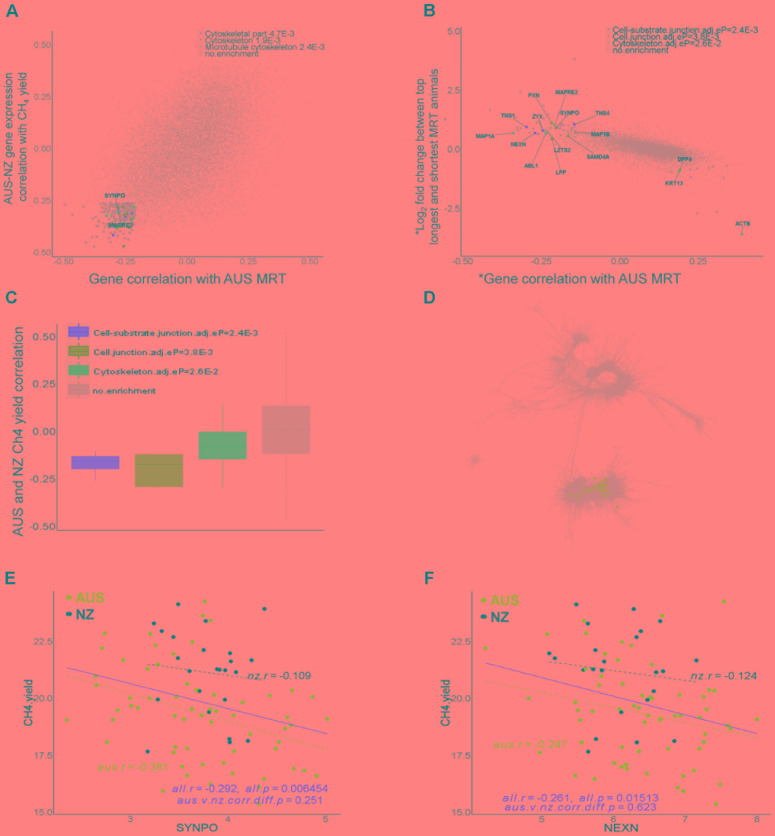
Genes associated with rumen feed mean retention time (MRT). (A) Transcriptome-wide relationships between the correlations of expression of individual genes with AUS MRT values and CH4 yield (g/day/dry matter intake, kg/d) in across the combined AUS and NZ datasets. The top 200 genes with negative correlations for both phenotypes were analyzed for DAVID enrichment and terms with adjusted enrichment p-values < 0.05 are indicated. (B) Transcriptome-wide relationships between the correlations of expression of individual genes with AUS MRT values and differential gene expression between the top 10 shortest and longest MRT animals in the AUS dataset. ∗ indicates the transcriptome data was normalized for the mean expression of muscle genes present in both the AUS and NZ gene network to remove the effect of the composition of the full thickness rumen wall samples. The genes indicated were analyzed for DAVID enrichment and terms with adjusted enrichment p-values < 0.05 are shown. The list of genes with their p-values and FDR for differential expression between long and short MRT animals can be found in Supplementary Table S6. (C) Expression of genes in enriched pathways in (B) were plotted for their correlations with CH4 yield across both the AUS and NZ datasets. (D) Location of genes showing significant differential expression between long and short MRT animals and with negative correlations (within top 200) with MRT in the AUS-NZ combined network. For genes with enrichments their colors correspond to dot colors in panel (B). (E,F) Scatter plots of gene expression correlations with CH4 yield in the animals in the AUS and NZ datasets for example genes from the set of genes identified in the analysis above.

